Multiple Choice
Identify the
choice that best completes the statement or answers the question.
|
|
|
Use the graph or table to write a linear function that relates y to
x.
|
|
|
1.
|
a. | y =  x x | c. | y =  x x | b. | y =  x x | d. | y =  x x |
|
|
|
2.
|
a. | y =  x – 6 x – 6 | c. | y =  x
– 6 x
– 6 | b. | y =  x + 6 x + 6 | d. | y =  x +
6 x +
6 |
|
|
|
3.
|
a. | y =  x + 3 x + 3 | c. | y =  x
– 3 x
– 3 | b. | y =  x – 3 x – 3 | d. | y =  x +
3 x +
3 |
|
|
|
4.
|
a. | y =  x + 2 x + 2 | c. | y =  x
– 2 x
– 2 | b. | y =  x + 2 x + 2 | d. | y =  x –
2 x –
2 |
|
|
|
5.
|
a. | y = –2 | c. | y = x – 2 | b. | x = y
– 2 | d. | x =
–2 |
|
|
|
6.
|
Which equation does not belong with the other three?
a. | 11 = 3xy | c. | 22y =
6x | b. | y =  x x | d. | 11y =
3x |
|
Short Answer
|
|
|
1.
|
Describe four ways to represent a function.
|
|
|
2.
|
Is the function represented by the graph a linear function? Explain. 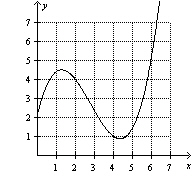
|
|
|
Graph the data in the table. Decide whether the function is linear or
nonlinear.
|
|
|
3.
|
|
|
|
Does the table or graph represent a linear or nonlinear
function? Explain.
|
|
|
4.
|
|
|
|
Does the equation represent a linear or nonlinear function?
Explain.
|
|
|
5.
|
3 + xy = 8x – y
|
|
|
6.
|
The table shows the height x (in feet) and number y of stories of
four buildings. Does the table represent a linear or nonlinear function?
Explain. Building | Height, x | Stories,
y | | Sears Tower, Chicago | 1450 | 110 | | Empire State Building,
New York | 1250 | 102 | | Aon Center,
Chicago | 1136 | 80 | | Chrysler Building, New
York | 1046 | 77 | | | |
|