Multiple Choice
Identify the
choice that best completes the statement or answers the question.
|
|
|
1.
|
Describe the shape of the distribution. Box
Widths | 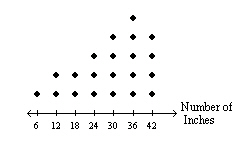 | |
a. | skewed left | c. | skewed right | b. | symmetric | d. | even
distribution |
|
|
|
2.
|
Describe the shape of the distribution. Air
Temperature | 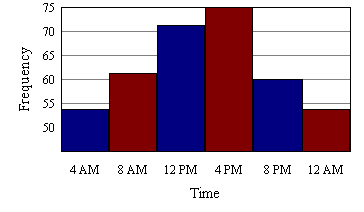 | |
a. | symmetric | c. | skewed right | b. | skewed left | d. | even
distribution |
|
|
|
Choose the most appropriate measures to describe the center and the
variation. Find the measures you chose.
|
|
|
3.
|
Campground Fees | 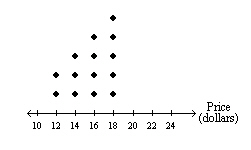 | |
a. | median and IQR:
median: 16
IQR: 4 | c. | median and IQR:
median:
18
IQR: 14 | b. | mean and MAD;
mean: 15.7
MAD: 1.8 | d. | mean and MAD;
mean: 15.7
MAD:
4 |
|
|
|
4.
|
Monthly Precipitation | 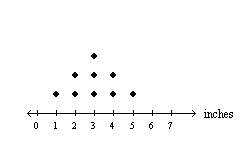 | |
a. | mean and MAD;
mean: 3
MAD: 0.9 | c. | median and IQR:
median:
3
IQR: 2 | b. | mean and MAD;
mean: 3
MAD: 0.4 | d. | median and IQR:
median: 1
IQR:
0.9 |
|
Short Answer
|
|
|
Make a box-and-whisker plot for the data.
|
|
|
1.
|
Distance (in miles) to the nearest town: 6, 19, 14, 19, 14, 12, 12, 30
|
|
|
2.
|
Hours spent on homework in a week: 7, 9, 1, 7, 5, 9, 14, 6, 13, 3
|
|
|
3.
|
The frequency table shows the highest technical certification levels for
employees in the East and West Coast territories of the United States within a large company. Display
the data for each territory in a histogram. Describe the shape of each distribution. Which
territory’s technicians have the lowest level of certification? Explain. | Level of
Certification | 1 | 2 | 3 | 4 | 5 | 6 | 7 | | East Coast Territory | 2 | 4 | 9 | 12 | 10 | 6 | 2 | | West Coast Territory | 5 | 11 | 11 | 8 | 7 | 4 | 1 | | | | | | | | |
|