Multiple Choice
Identify the
choice that best completes the statement or answers the question.
|
|
|
1.
|
Describe the shape of the distribution. Number of
Brothers | 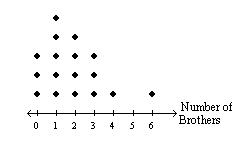 | |
a. | even distribution | c. | skewed right | b. | symmetric | d. | skewed left |
|
|
|
Choose the most appropriate measures to describe the center and the
variation. Find the measures you chose.
|
|
|
2.
|
Campground Fees | 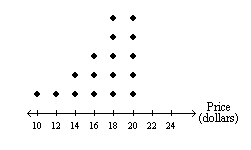 | |
a. | median and IQR:
median: 18
IQR: 5 | c. | median and IQR:
median:
0
IQR: 15 | b. | mean and MAD;
mean: 16.9
MAD: 2.4 | d. | mean and MAD;
mean: 16.9
MAD:
5 |
|
|
|
3.
|
Identify the shape of the distribution.  a. | symmetrical | c. | even distribution | b. | skewed right | d. | skewed left |
|
Short Answer
|
|
|
Make a stem-and-leaf plot of the data.
|
|
|
1.
|
Hours Online | 11 | 13 | 9 | 13 | 17 | 6 | 20 | 12 | 14 | 4 | 17 | 22 | | | | |
|
|
|
2.
|
Test
Scores (%) | 76 | 93 | 95 | 82 | 91 | 85 | 97 | 77 | 67 | 94 | 64 | 90 | 95 | 79 | 65 | | | | | |
|
|
|
Display the data in a histogram.
|
|
|
3.
|
Playoff Base Hits | Hits | Frequency | 6-8 | 12 | 9-11 | 13 | 12-14 | 9 | 15-17 | 10 | | |
|
|
|
4.
|
Describe the shape of the distribution of the bar graph. Match the letters A, B,
and C with the mean, the median, and the mode of the data set. Explain your reasoning. 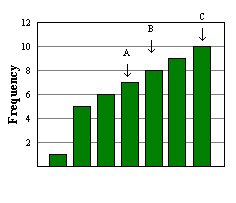
|
|
|
5.
|
The double box-and-whisker plot compares the battery life (in hours) of two
brands of laptops. a. What is the range of the upper 75% of each
brand? b. Which brand has a longer battery life? Explain.  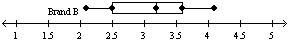 Battery Life (hours)
|
|
|
Make a box-and-whisker plot for the data.
|
|
|
6.
|
Bottles of energy drink: 4, 4, 9, 1, 13, 7, 4, 4, 9, 9, 11, 7
|
|
|
7.
|
Elevations (in feet): 7, –1, 2, 10, –6, –1, –7, 4, 2, 7,
2, 10
|